Testing RAG in the Wild: Ghana’s Health Policies as a Case Study
2024-05-17 • 7 min read
Testing RAG in the Wild: Ghana’s Health Policies as a Case Study
Can Retrieval-Augmented Generation (RAG) work reliably on real-world government PDFs in low-resource domains like public health in Ghana? That was the central question behind this project._
Context: The Problem with Policy Access in Low-Resource Domains
Ghana’s Ministry of Health publishes critical national policy documents as PDF files — spanning topics like antimicrobial resistance, malaria protocols, medical waste, and healthcare financing. These documents are comprehensive, but they’re not search-friendly. They lack structure, indexing, or semantic markup. Worse, many are lengthy, scanned, or inconsistently formatted.
This makes it difficult for health workers, researchers, or journalists to extract factual answers quickly — even for seemingly simple questions like:
- What treatment does Ghana recommend for malaria in the first trimester?
- What is the country’s official stance on antibiotic use in livestock?
While RAG has shown strong performance in benchmark datasets like Natural Questions or TriviaQA, these datasets are clean, structured, and mostly Western-centric. I wanted to explore how RAG behaves when applied to noisy, under-curated, and domain-specific documents in an African context.
Approach: How I Built the QA Pipeline
Step 1: Real Document Scraping
I collected 36 PDF documents from moh.gov.gh, Ghana’s Ministry of Health portal. I filtered out unusable scans using word count heuristics and retained machine-readable documents for processing.
Step 2: Chunking Strategies
I experimented with three chunking approaches:
- Fixed-size chunks: 300-word windows (used for baseline RAG)
- Overlapping chunks: 300-word chunks with 100-word stride
- Sentence-based chunks: using NLTK tokenization
All chunk logs were saved for retrieval analysis. Sentence-based and overlap chunking are reserved for follow-up evaluation.
Step 3: Retriever + Generator
-
Embedded all chunks using
sentence-transformers (MiniLM) -
Indexed with FAISS
-
Used Hugging Face’s
flan-t5-basefor:- Zero-context (baseline) generation
- RAG-based generation using top-3 retrieved chunks
-
Truncated inputs to a max of 480 tokens for safety
Step 4: Manual Evaluation
I manually annotated 10 gold QA pairs drawn directly from the PDFs. These pairs served as a stable benchmark to compare:
- Baseline answers (just the question, no context)
- RAG answers (question + retrieved chunks)
Each answer was rated on:
- Accuracy (1, 0.5, 0)
- Hallucination (binary)
- Fluency (binary)
Results: What Surprised Me
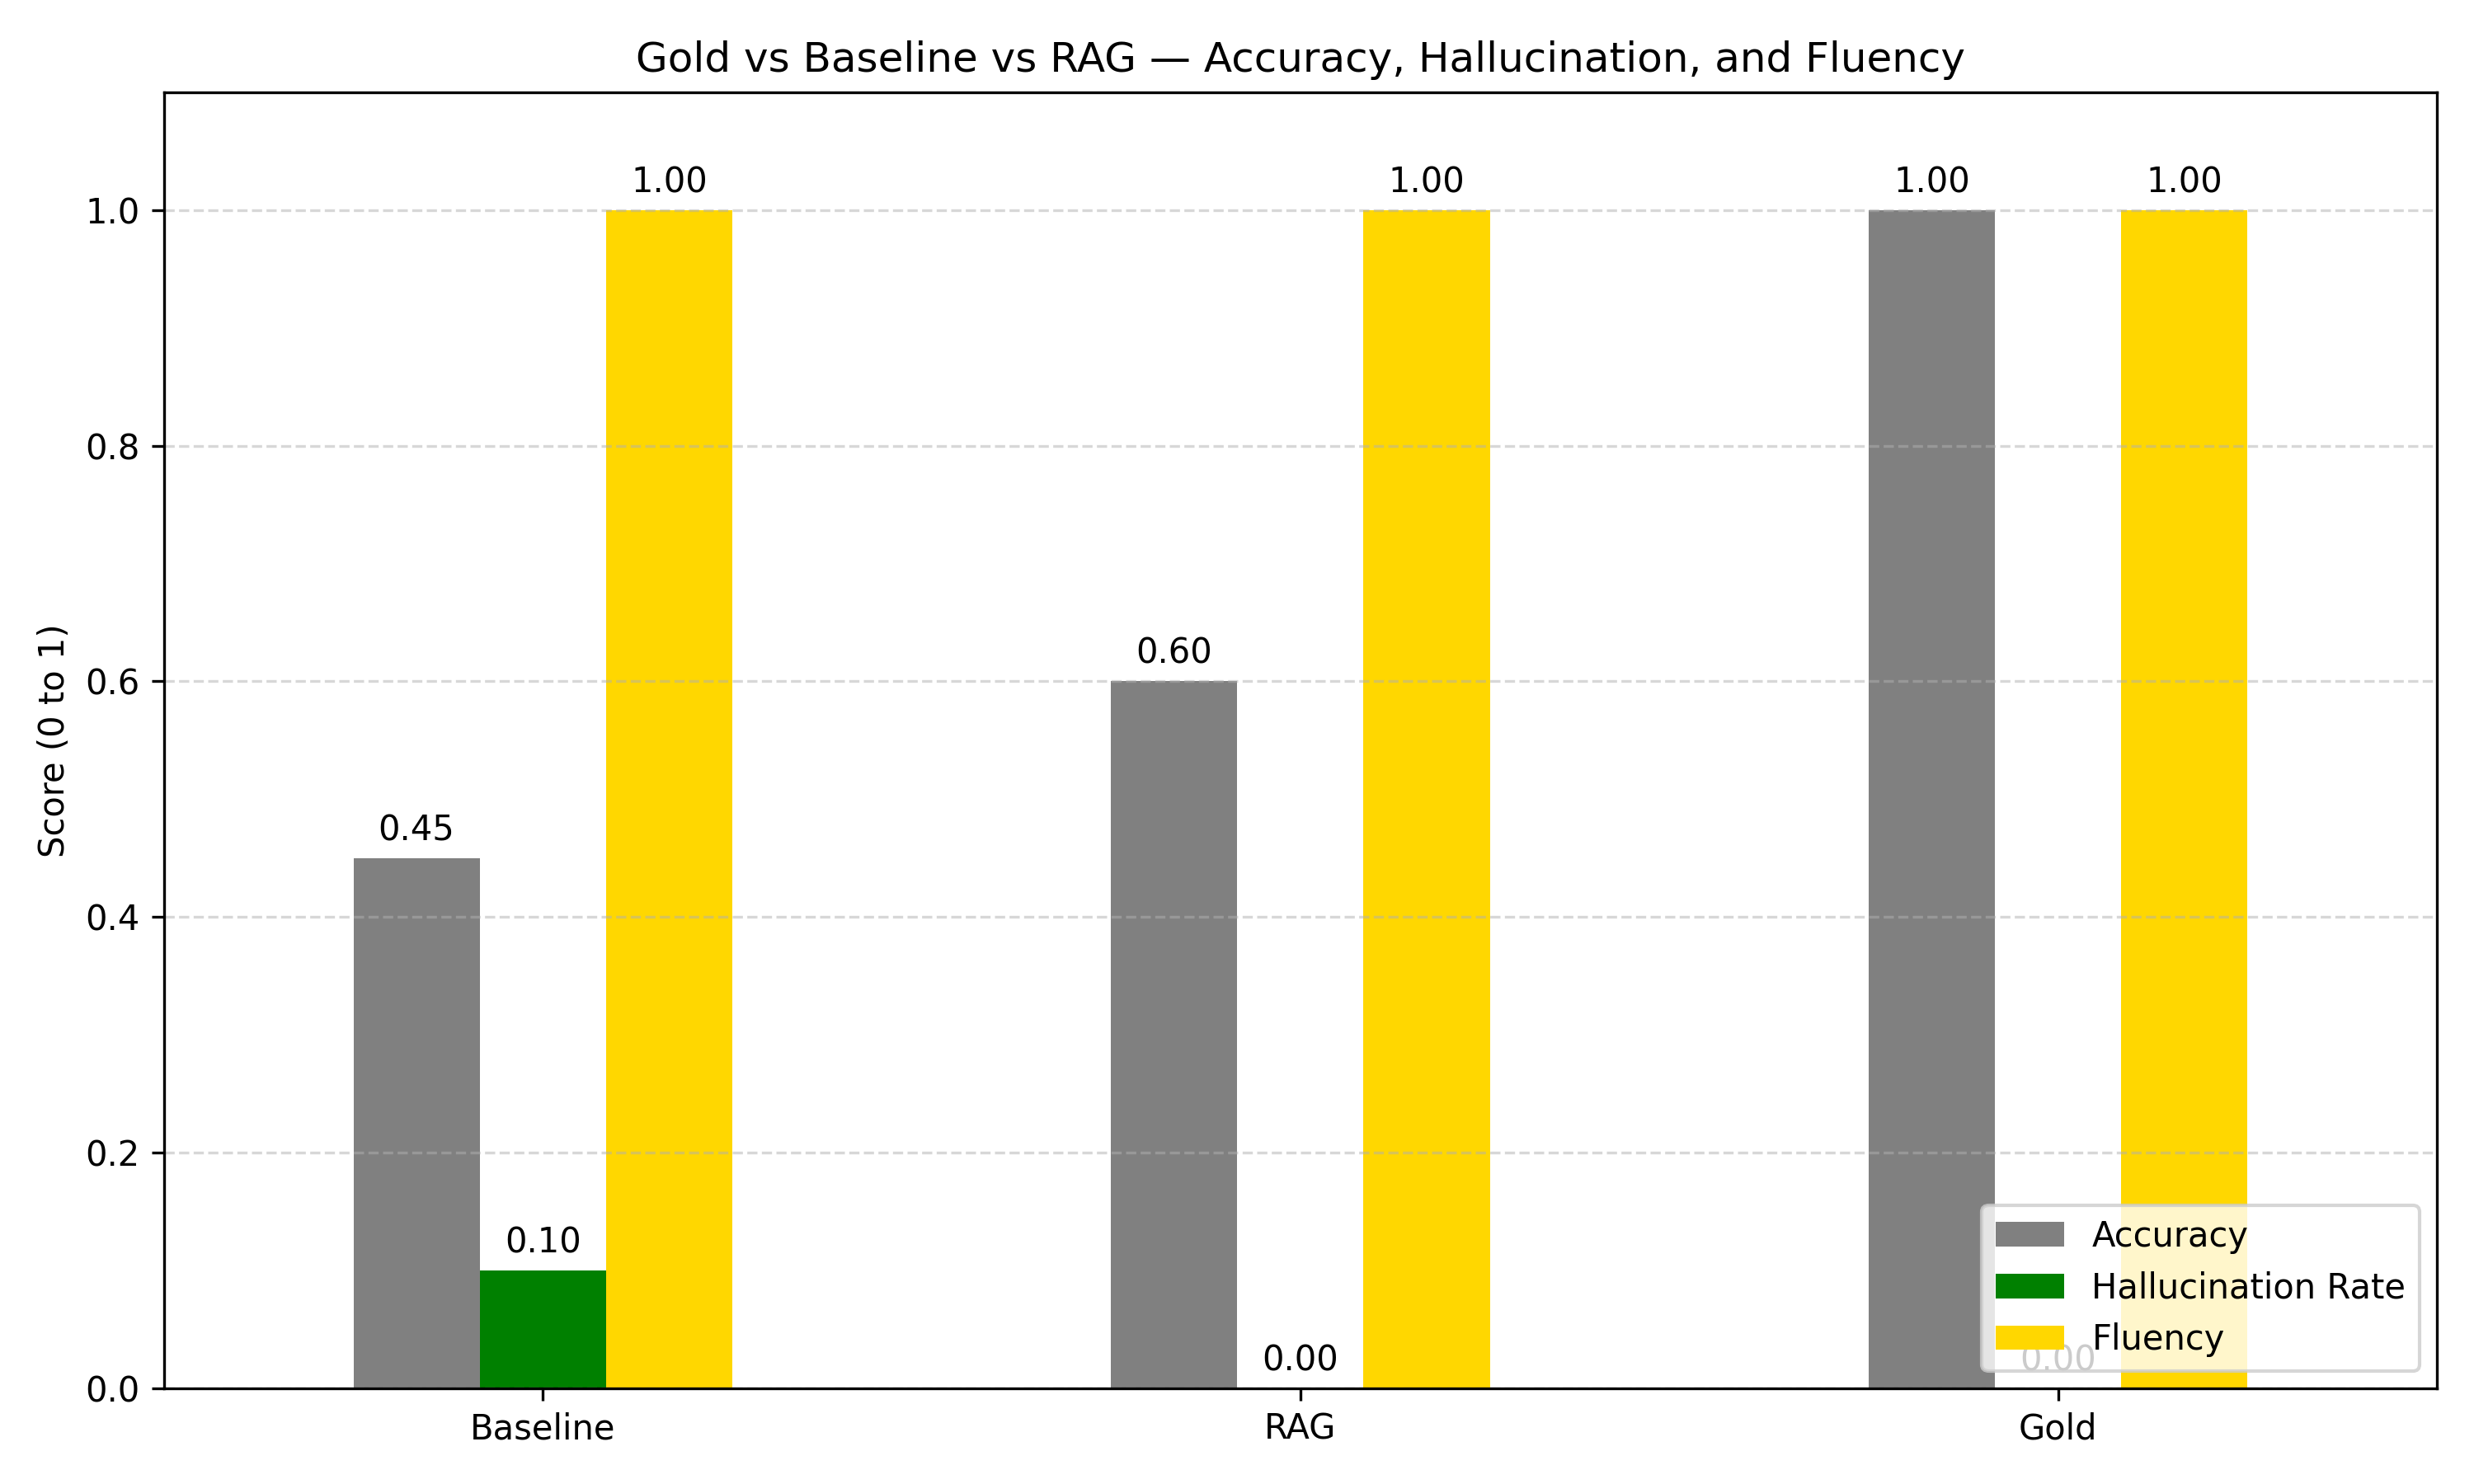
| Metric        | Baseline | RAG  | Gold |
| ------------- | -------- | ---- | ---- |
| Accuracy      | 0.45     | 0.60 | 1.00 |
| Hallucination | 0.10     | 0.00 | 0.00 |
| Fluency       | 1.00     | 1.00 | 1.00 |
- Hallucination completely disappeared in RAG mode — likely because retrieved chunks acted as factual anchors.
- Accuracy improved by 33%, but still far from perfect. Some retrievals were off-target or contextually too vague.
- Baseline answers sounded fluent, but were often confidently wrong — a dangerous trait in factual domains like health policy.
Research Reflections
This wasn’t about pushing SOTA performance. It was about testing how modern QA tools behave outside benchmark environments, on real-world policy documents in a region and sector often ignored in NLP.
Key insights:
- Chunking matters more than you think — overlapping windows may help mitigate retrieval gaps in long, dense documents.
- Fluency ≠ Factuality — baseline models sounded right, even when hallucinating.
- There’s no shortcut to evaluation — without gold answers, everything looks good. Manual QA grounding was tedious but essential.
Future Work
- Expand gold QA pairs to 50+ and evaluate Recall@k per chunking method.
- Compare chunking strategies (fixed vs sentence vs overlap) on real retrieval quality.
- Try hallucination-aware or citation-based models like GPT-4 Turbo or Llama Guard.
- Extend the dataset to include Twi, Pidgin, and other local languages used in public health communication.
- Package this as an interface for journalists, NGOs, or health workers.